On This Page:ToggleImportanceCalculationInterpretationProbability EstimationHypothesis TestingPractice Problems for Z-ScoresCalculating a Raw ScoreCalculating a Z-Score using ExcelFAQs
On This Page:Toggle
On This Page:
A z-score is a statistical measure that describes the position of a raw score in terms of its distance from the mean, measured in standard deviation units. A positive z-score indicates that the value lies above the mean, while a negative z-score indicates that the value lies below the mean.
 Figure 1. A standard normal distribution (SND).
Why Are Z-Scores Important?
How To Calculate
The formula for calculating a z-score is z = (x-μ)/σ, where x is the raw score, μ is the population mean, and σ is the population standard deviation.
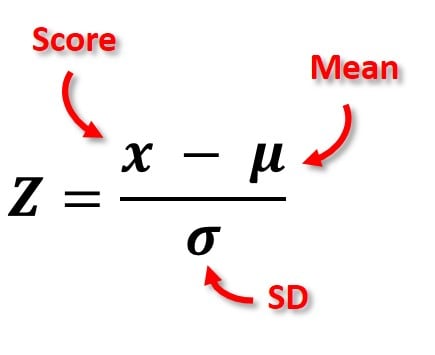 Figure 2. The Z-score formula in a population.
When the population mean and the population standard deviation are unknown, the standard score may be calculated using the sample mean (x̄) and sample standard deviation (s) as estimates of the population values.
To calculate a z-score, follow these steps:
Interpretation
The value of the z-score tells you how many standard deviations you are away from the mean. A larger absolute value indicates a greater distance from the mean.
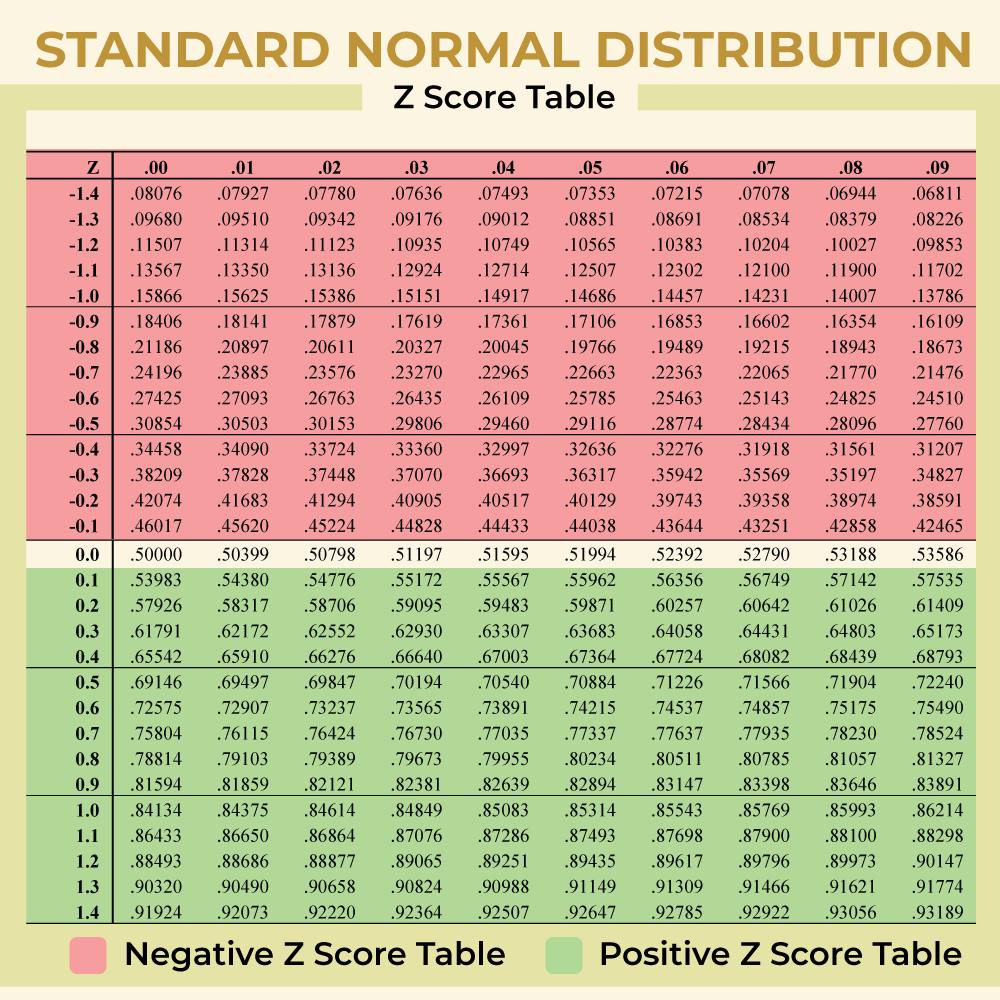
Probability EstimationWhen working with z-scores, the data is assumed to follow a standard normal distribution with a mean of 0 and a standard deviation of 1. This allows for the use of standard normal distribution tables or calculators to determine probabilities.The z-score tells us how many standard deviations a data point is from the mean. Once we know the z-score, we can estimate the probability of a data point falling within a specific range or being above or below a certain value.In a standard normal distribution, there’s a handy rule called the empirical rule, or the 68-95-99.7 rule. This rule states that:Approximately 68% of the data falls within one standard deviation of the mean (z-scores between -1 and 1).Around 95% of the data falls within two standard deviations of the mean (z-scores between -2 and 2).Nearly 99.7% of the data falls within three standard deviations of the mean (z-scores between -3 and 3).Figure 3 shows the proportion of a standard normal distribution in percentages. As you can see, there’s a 95% probability of randomly selecting a score between -1.96 and +1.96 standard deviations from the mean.Figure 3. The proportion of a standard normal distribution (SND) in percentages.Using the standard normal distribution, researchers can calculate the probability of randomly obtaining a score from the sample. For example, there’s a 68% chance of randomly selecting a score between -1 and +1 standard deviations from the mean.Hypothesis TestingUsing az-score tablelets you quickly determine the probability associated with a specific value in a dataset, helping you make decisions and draw conclusions based on your data.
Probability EstimationWhen working with z-scores, the data is assumed to follow a standard normal distribution with a mean of 0 and a standard deviation of 1. This allows for the use of standard normal distribution tables or calculators to determine probabilities.The z-score tells us how many standard deviations a data point is from the mean. Once we know the z-score, we can estimate the probability of a data point falling within a specific range or being above or below a certain value.In a standard normal distribution, there’s a handy rule called the empirical rule, or the 68-95-99.7 rule. This rule states that:Approximately 68% of the data falls within one standard deviation of the mean (z-scores between -1 and 1).Around 95% of the data falls within two standard deviations of the mean (z-scores between -2 and 2).Nearly 99.7% of the data falls within three standard deviations of the mean (z-scores between -3 and 3).Figure 3 shows the proportion of a standard normal distribution in percentages. As you can see, there’s a 95% probability of randomly selecting a score between -1.96 and +1.96 standard deviations from the mean.
Probability Estimation
When working with z-scores, the data is assumed to follow a standard normal distribution with a mean of 0 and a standard deviation of 1. This allows for the use of standard normal distribution tables or calculators to determine probabilities.
The z-score tells us how many standard deviations a data point is from the mean. Once we know the z-score, we can estimate the probability of a data point falling within a specific range or being above or below a certain value.
In a standard normal distribution, there’s a handy rule called the empirical rule, or the 68-95-99.7 rule. This rule states that:
Figure 3 shows the proportion of a standard normal distribution in percentages. As you can see, there’s a 95% probability of randomly selecting a score between -1.96 and +1.96 standard deviations from the mean.
Figure 3. The proportion of a standard normal distribution (SND) in percentages.Using the standard normal distribution, researchers can calculate the probability of randomly obtaining a score from the sample. For example, there’s a 68% chance of randomly selecting a score between -1 and +1 standard deviations from the mean.Hypothesis Testing
Figure 3. The proportion of a standard normal distribution (SND) in percentages.

Using the standard normal distribution, researchers can calculate the probability of randomly obtaining a score from the sample. For example, there’s a 68% chance of randomly selecting a score between -1 and +1 standard deviations from the mean.
Hypothesis Testing
Using az-score tablelets you quickly determine the probability associated with a specific value in a dataset, helping you make decisions and draw conclusions based on your data.
The significance level (α) is the probability threshold for rejecting the null hypothesis. Common significance levels are 0.01, 0.05, and 0.10. The critical values are the z-scores that correspond to the chosen significance level. These values can be found using a standard normal distribution table or calculator.
A Z-score table shows the percentage of values (usually a decimal figure) to the left of a given Z-score on a standard normal distribution.
1. Identify the parts of the z-score:
2. Find the corresponding probability in the z-score table:
3. Interpret the probability:
p-value from z-score calculatorZ-score:Significance Level:0.010.050.10Test Type:One-tailedTwo-tailedCalculateP-value:Conclusion:
p-value from z-score calculator
Z-score:
Significance Level:0.010.050.10
Test Type:One-tailedTwo-tailed
One-tailedTwo-tailed
P-value:Conclusion:
P-value:
Conclusion:
Practice Problems for Z-Scores
Calculate the z-scores for the following:
Sample Questions
Answers for Sample Questions
Calculating a Raw Score
Sometimes, we know a z-score and want to find the corresponding raw score. The formula for calculating a z-score in a sample into a raw score is given below:
X = (z)(SD) + mean
As the formula shows, the z-score and standard deviation are multiplied together, and this figure is added to the mean.
Check your answer makes sense: If we have a negative z-score, the corresponding raw score should be less than the mean, and a positive z-score must correspond to a raw score higher than the mean.
Calculating a Z-Score using Excel
For example, if the range of scores in your sample begins at cell A1 and ends at cell A20, the formula =AVERAGE(A1:A20) returns the average of those numbers.
Now to calculate the z-score, type the following formula in an empty cell: = (x – mean) / [standard deviation].
To make things easier, instead of writing the mean and SD values in the formula, you could use the cell values corresponding to these values. For example, = (A12 – B1) / [C1].
Then, to calculate the probability for a SMALLER z-score, which is the probability of observing a value less than x (the area under the curve to the LEFT of x), type the following into a blank cell: = NORMSDIST( and input the z-score you calculated).
To find the probability of LARGER z-score, which is the probability of observing a value greater than x (the area under the curve to the RIGHT of x), type: =1 – NORMSDIST (and input the z-score you calculated).
Frequently Asked Questions
Can z-scores be used with any type of data, regardless of distribution?Z-scores are commonly used to standardize and compare data across different distributions. They are most appropriate for data that follows a roughly symmetric and bell-shaped distribution.However, they can still provide useful insights for other types of data, as long as certain assumptions are met. Yet, for highly skewed or non-normal distributions, alternative methods may be more appropriate.It’s important to consider the characteristics of the data and the goals of the analysis when determining whether z-scores are suitable or if other approaches should be considered.How can understanding z-scores contribute to better research and statistical analysis in psychology?Understanding z-scores enhances research and statistical analysis in psychology. Z-scores standardize data for meaningful comparisons, identify outliers, and assess likelihood.They aid in interpreting practical significance, applying statistical tests, and making accurate conclusions. Z-scores provide a common metric, facilitating communication of findings.By using z-scores, researchers improve rigor, objectivity, and clarity in their work, leading to better understanding and knowledge in psychology.Can a z-score be used to determine the likelihood of an event occurring?No, a z-score itself cannot directly determine the likelihood of an event occurring. However, it provides information about the relative position of a data point within a distribution.By converting data to z-scores, researchers can assess how unusual or extreme a value is compared to the rest of the distribution. This can help estimate the probability or likelihood of obtaining a particular score or more extreme values.So, while z-scores provide insights into the relative rarity of an event, they do not directly determine the likelihood of the event occurring on their own.
Can z-scores be used with any type of data, regardless of distribution?Z-scores are commonly used to standardize and compare data across different distributions. They are most appropriate for data that follows a roughly symmetric and bell-shaped distribution.However, they can still provide useful insights for other types of data, as long as certain assumptions are met. Yet, for highly skewed or non-normal distributions, alternative methods may be more appropriate.It’s important to consider the characteristics of the data and the goals of the analysis when determining whether z-scores are suitable or if other approaches should be considered.
Can z-scores be used with any type of data, regardless of distribution?
Z-scores are commonly used to standardize and compare data across different distributions. They are most appropriate for data that follows a roughly symmetric and bell-shaped distribution.However, they can still provide useful insights for other types of data, as long as certain assumptions are met. Yet, for highly skewed or non-normal distributions, alternative methods may be more appropriate.It’s important to consider the characteristics of the data and the goals of the analysis when determining whether z-scores are suitable or if other approaches should be considered.
Z-scores are commonly used to standardize and compare data across different distributions. They are most appropriate for data that follows a roughly symmetric and bell-shaped distribution.
However, they can still provide useful insights for other types of data, as long as certain assumptions are met. Yet, for highly skewed or non-normal distributions, alternative methods may be more appropriate.
It’s important to consider the characteristics of the data and the goals of the analysis when determining whether z-scores are suitable or if other approaches should be considered.
How can understanding z-scores contribute to better research and statistical analysis in psychology?Understanding z-scores enhances research and statistical analysis in psychology. Z-scores standardize data for meaningful comparisons, identify outliers, and assess likelihood.They aid in interpreting practical significance, applying statistical tests, and making accurate conclusions. Z-scores provide a common metric, facilitating communication of findings.By using z-scores, researchers improve rigor, objectivity, and clarity in their work, leading to better understanding and knowledge in psychology.
How can understanding z-scores contribute to better research and statistical analysis in psychology?
Understanding z-scores enhances research and statistical analysis in psychology. Z-scores standardize data for meaningful comparisons, identify outliers, and assess likelihood.They aid in interpreting practical significance, applying statistical tests, and making accurate conclusions. Z-scores provide a common metric, facilitating communication of findings.By using z-scores, researchers improve rigor, objectivity, and clarity in their work, leading to better understanding and knowledge in psychology.
Understanding z-scores enhances research and statistical analysis in psychology. Z-scores standardize data for meaningful comparisons, identify outliers, and assess likelihood.
They aid in interpreting practical significance, applying statistical tests, and making accurate conclusions. Z-scores provide a common metric, facilitating communication of findings.
By using z-scores, researchers improve rigor, objectivity, and clarity in their work, leading to better understanding and knowledge in psychology.
Can a z-score be used to determine the likelihood of an event occurring?No, a z-score itself cannot directly determine the likelihood of an event occurring. However, it provides information about the relative position of a data point within a distribution.By converting data to z-scores, researchers can assess how unusual or extreme a value is compared to the rest of the distribution. This can help estimate the probability or likelihood of obtaining a particular score or more extreme values.So, while z-scores provide insights into the relative rarity of an event, they do not directly determine the likelihood of the event occurring on their own.
Can a z-score be used to determine the likelihood of an event occurring?
No, a z-score itself cannot directly determine the likelihood of an event occurring. However, it provides information about the relative position of a data point within a distribution.By converting data to z-scores, researchers can assess how unusual or extreme a value is compared to the rest of the distribution. This can help estimate the probability or likelihood of obtaining a particular score or more extreme values.So, while z-scores provide insights into the relative rarity of an event, they do not directly determine the likelihood of the event occurring on their own.
No, a z-score itself cannot directly determine the likelihood of an event occurring. However, it provides information about the relative position of a data point within a distribution.
By converting data to z-scores, researchers can assess how unusual or extreme a value is compared to the rest of the distribution. This can help estimate the probability or likelihood of obtaining a particular score or more extreme values.
So, while z-scores provide insights into the relative rarity of an event, they do not directly determine the likelihood of the event occurring on their own.
Further Information

![]()
Olivia Guy-Evans, MSc
BSc (Hons) Psychology, MSc Psychology of Education
Olivia Guy-Evans is a writer and associate editor for Simply Psychology. She has previously worked in healthcare and educational sectors.
Saul McLeod, PhD
BSc (Hons) Psychology, MRes, PhD, University of Manchester
Saul McLeod, PhD., is a qualified psychology teacher with over 18 years of experience in further and higher education. He has been published in peer-reviewed journals, including the Journal of Clinical Psychology.
