On This Page:ToggleHypothesis testingWhat a p-value tells youP-value interpretationHow to calculateHow to reportWhy is the p-value not enough?FAQs
On This Page:Toggle
On This Page:
The p-value in statistics quantifies the evidence against a null hypothesis. A low p-value suggests data is inconsistent with the null, potentially favoring an alternative hypothesis. Common significance thresholds are 0.05 or 0.01.

Hypothesis testing
When you perform a statistical test, a p-value helps you determine the significance of your results in relation to the null hypothesis.
Thenull hypothesis(H0) states no relationship exists between thetwo variables being studied(one variable does not affect the other). It states the results are due to chance and are not significant in supporting the idea being investigated. Thus, the null hypothesis assumes that whatever you try to prove did not happen.
The alternative hypothesis (Ha or H1) is the one you would believe if the null hypothesis is concluded to be untrue.
The alternative hypothesis states that the independent variable affected the dependent variable, and the results are significant in supporting the theory being investigated (i.e., the results are not due to random chance).
What a p-value tells you
The level of statistical significance is often expressed as a p-value between 0 and 1.
Remember, a p-value doesn’t tell you if the null hypothesis is true or false. It just tells you how likely you’d see the data you observed (or more extreme data) if the null hypothesis was true. It’s a piece of evidence, not a definitive proof.
Suppose you’re conducting a study to determine whether a new drug has an effect on pain relief compared to a placebo.
Conversely, if the new drug indeed reduces pain significantly, your test statistic will diverge further from what’s expected under the null hypothesis, and the p-value will decrease.
P-value interpretation
The significance level (alpha) is a set probability threshold (often 0.05), while the p-value is the probability you calculate based on your study or analysis.
A p-value less than or equal to a predetermined significance level (often 0.05 or 0.01) indicates a statistically significant result, meaning the observed data provide strong evidence against the null hypothesis.
This suggests the effect under study likely represents a real relationship rather than just random chance.
For instance, if you set α = 0.05, you would reject the null hypothesis if yourp-value ≤ 0.05.
It indicates strong evidence against the null hypothesis, as there is less than a 5% probability the null is correct (and the results are random).
Therefore, we reject the null hypothesis and accept the alternative hypothesis.
Upon analyzing the pain relief effects of the new drug compared to the placebo, the computed p-value is less than 0.01, which falls well below the predetermined alpha value of 0.05.
Consequently, you conclude that there is a statistically significant difference in pain relief between the new drug and the placebo.
A p-value of 0.001 is highly statistically significant beyond the commonly used 0.05 threshold. It indicates strong evidence of a real effect or difference, rather than just random variation.
Specifically, a p-value of 0.001 means there is only a 0.1% chance of obtaining a result at least as extreme as the one observed, assuming the null hypothesis is correct.
Such a small p-value provides strong evidence against the null hypothesis, leading to rejecting the null in favor of the alternative hypothesis.
This means we retain the null hypothesis and reject the alternative hypothesis. You should note that you cannot accept the null hypothesis; we can only reject it or fail to reject it.
Note: when the p-valueis above your threshold of significance,it does not mean that there is a 95% probability that the alternative hypothesis is true.
One-Tailed Test
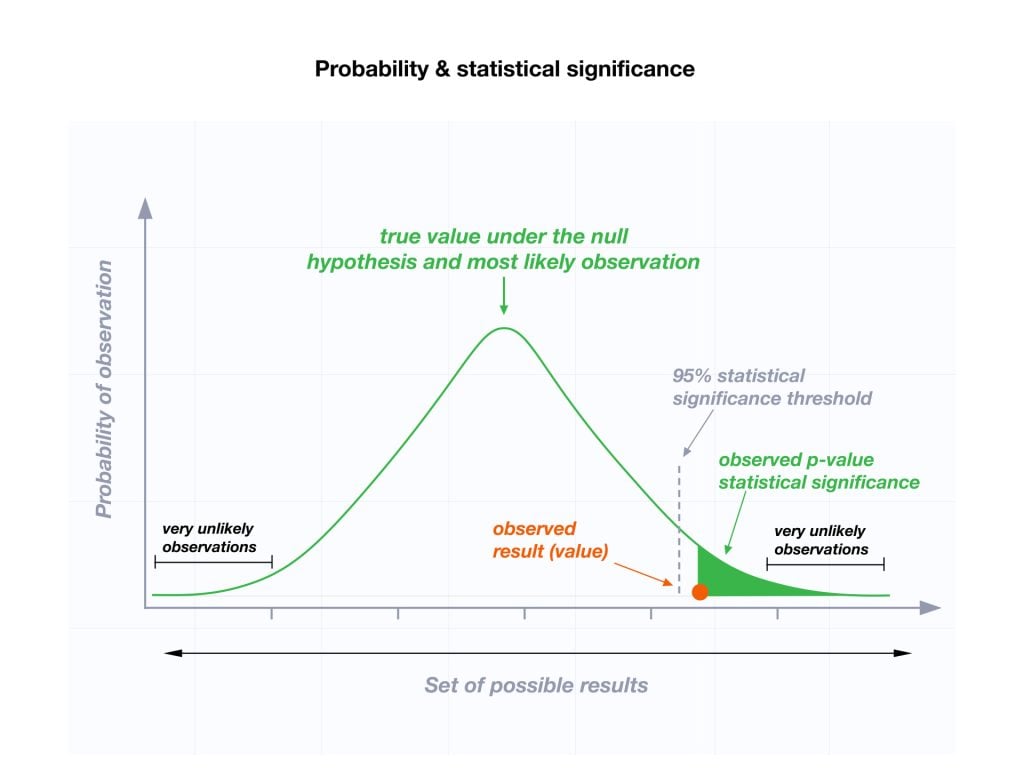
In a normal distribution, the significance level corresponds to regions in the tails of the curve. In a one-tailed test, the entire significance level is allocated to one tail of the distribution. For example, if you are using a significance level of 0.05 (5%), you would reject the null hypothesis if your data point falls in the 5% tail on either the right (for a right-tailed test) or the left (for a left-tailed test) end of the distribution. In this example, the observed value is statistically significant (p ≤ 0.05), so the null hypothesis (H0) is rejected, and the alternative hypothesis (Ha) is accepted.
Two-Tailed Test
In a normal distribution, the significance level corresponds to regions in the tails of the curve. In a two-tailed test, you have two regions each constituting 2.5% of the area under the curve. Any data point landing in these extreme regions would be considered statistically significant at the 0.05 level, leading you to reject the null hypothesis.

How do you calculate thep-value?Most statistical software packages like R, SPSS, and others automatically calculate your p-value. This is the easiest and most common way.Online resources and tables are available to estimate the p-value based on your test statistic and degrees of freedom.These tables help you understand how often you would expect to see your test statistic under the null hypothesis.Understanding the Statistical Test:Different statistical tests are designed to answer specific research questions or hypotheses. Each test has its own underlying assumptions and characteristics.For example, you might use a t-test to compare means, achi-squared testfor categorical data, or a correlation test to measure the strength of a relationship between variables.Be aware that the number of independent variables you include in your analysis can influence the magnitude of the test statistic needed to produce the same p-value.This factor is particularly important to consider when comparing results across different analyses.Example: Choosing a Statistical TestIf you’re comparing the effectiveness of just two different drugs in pain relief, a two-sample t-test is a suitable choice for comparing these two groups. However, when you’re examining the impact of three or more drugs, it’s more appropriate to employ an Analysis of Variance (ANOVA).Utilizing multiple pairwise comparisons in such cases can lead to artificially low p-values and an overestimation of the significance of differences between the drug groups.How to report
How do you calculate thep-value?
Most statistical software packages like R, SPSS, and others automatically calculate your p-value. This is the easiest and most common way.
Online resources and tables are available to estimate the p-value based on your test statistic and degrees of freedom.
These tables help you understand how often you would expect to see your test statistic under the null hypothesis.
Understanding the Statistical Test:
Different statistical tests are designed to answer specific research questions or hypotheses. Each test has its own underlying assumptions and characteristics.
For example, you might use a t-test to compare means, achi-squared testfor categorical data, or a correlation test to measure the strength of a relationship between variables.
Be aware that the number of independent variables you include in your analysis can influence the magnitude of the test statistic needed to produce the same p-value.
This factor is particularly important to consider when comparing results across different analyses.
If you’re comparing the effectiveness of just two different drugs in pain relief, a two-sample t-test is a suitable choice for comparing these two groups. However, when you’re examining the impact of three or more drugs, it’s more appropriate to employ an Analysis of Variance (ANOVA).
Utilizing multiple pairwise comparisons in such cases can lead to artificially low p-values and an overestimation of the significance of differences between the drug groups.
How to report
A statistically significant result cannot prove that a research hypothesis is correct (which implies 100% certainty).
In our comparison of the pain relief effects of the new drug and the placebo, we observed that participants in the drug group experienced a significant reduction in pain (M= 3.5;SD= 0.8) compared to those in the placebo group (M= 5.2;SD= 0.7), resulting in an average difference of 1.7 points on the pain scale (t(98) = -9.36;p< 0.001).
APA Style
The 6th edition of the APA style manual (American Psychological Association, 2010) states the following on the topic of reporting p-values:
“When reportingpvalues, report exactpvalues (e.g., p = .031) to two or three decimal places. However, reportpvalues less than .001 asp< .001.
The tradition of reportingpvalues in the formp< .10,p< .05, p < .01, and so forth, was appropriate in a time when only limited tables of critical values were available.” (p. 114)
Why is thep-value not enough?
A lowerp-valueis sometimes interpreted as meaning there is a stronger relationship between two variables.
However, statistical significance means that it is unlikely that the null hypothesis is true (less than 5%).
To understand the strength of the difference between the two groups (control vs. experimental) a researcher needs to calculate theeffect size.
FAQs
When do you reject the null hypothesis?In statistical hypothesis testing, you reject the null hypothesis when the p-value is less than or equal to the significance level (α) you set before conducting your test. The significance level is the probability of rejecting the null hypothesis when it is true. Commonly used significance levels are 0.01, 0.05, and 0.10.Remember, rejecting the null hypothesis doesn’t prove the alternative hypothesis; it just suggests that the alternative hypothesis may be plausible given the observed data.Thep-value is conditional upon the null hypothesis being true but is unrelated to the truth or falsity of the alternative hypothesis.What does p-value of 0.05 mean?If your p-value is less than or equal to 0.05 (the significance level), you would conclude that your result is statistically significant. This means the evidence is strong enough to reject the null hypothesis in favor of the alternative hypothesis.Are all p-values below 0.05 considered statistically significant?No, not all p-values below 0.05 are considered statistically significant. The threshold of 0.05 is commonly used, but it’s just a convention. Statistical significance depends on factors like the study design, sample size, and the magnitude of the observed effect.A p-value below 0.05 means there is evidence against the null hypothesis, suggesting a real effect. However, it’s essential to consider the context and other factors when interpreting results.Researchers also look at effect size and confidence intervals to determine the practical significance and reliability of findings.How does sample size affect the interpretation of p-values?Sample size can impact the interpretation of p-values. A larger sample size provides more reliable and precise estimates of the population, leading to narrower confidence intervals.With a larger sample, even small differences between groups or effects can become statistically significant, yielding lower p-values. In contrast, smaller sample sizes may not have enough statistical power to detect smaller effects, resulting in higher p-values.Therefore, a larger sample size increases the chances of finding statistically significant results when there is a genuine effect, making the findings more trustworthy and robust.Can a non-significant p-value indicate that there is no effect or difference in the data?No, a non-significant p-value does not necessarily indicate that there is no effect or difference in the data. It means that the observed data do not provide strong enough evidence to reject the null hypothesis.There could still be a real effect or difference, but it might be smaller or more variable than the study was able to detect.Other factors like sample size, study design, and measurement precision can influence the p-value. It’s important to consider the entire body of evidence and not rely solely on p-values when interpreting research findings.Can P values be exactly zero?While a p-value can be extremely small, it cannot technically be absolute zero. When a p-value is reported asp= 0.000, the actual p-value is too small for the software to display. This is often interpreted as strong evidence against the null hypothesis. For p values less than 0.001, report asp< .001
When do you reject the null hypothesis?In statistical hypothesis testing, you reject the null hypothesis when the p-value is less than or equal to the significance level (α) you set before conducting your test. The significance level is the probability of rejecting the null hypothesis when it is true. Commonly used significance levels are 0.01, 0.05, and 0.10.Remember, rejecting the null hypothesis doesn’t prove the alternative hypothesis; it just suggests that the alternative hypothesis may be plausible given the observed data.Thep-value is conditional upon the null hypothesis being true but is unrelated to the truth or falsity of the alternative hypothesis.
When do you reject the null hypothesis?
In statistical hypothesis testing, you reject the null hypothesis when the p-value is less than or equal to the significance level (α) you set before conducting your test. The significance level is the probability of rejecting the null hypothesis when it is true. Commonly used significance levels are 0.01, 0.05, and 0.10.Remember, rejecting the null hypothesis doesn’t prove the alternative hypothesis; it just suggests that the alternative hypothesis may be plausible given the observed data.Thep-value is conditional upon the null hypothesis being true but is unrelated to the truth or falsity of the alternative hypothesis.
In statistical hypothesis testing, you reject the null hypothesis when the p-value is less than or equal to the significance level (α) you set before conducting your test. The significance level is the probability of rejecting the null hypothesis when it is true. Commonly used significance levels are 0.01, 0.05, and 0.10.
Remember, rejecting the null hypothesis doesn’t prove the alternative hypothesis; it just suggests that the alternative hypothesis may be plausible given the observed data.
Thep-value is conditional upon the null hypothesis being true but is unrelated to the truth or falsity of the alternative hypothesis.
What does p-value of 0.05 mean?If your p-value is less than or equal to 0.05 (the significance level), you would conclude that your result is statistically significant. This means the evidence is strong enough to reject the null hypothesis in favor of the alternative hypothesis.
What does p-value of 0.05 mean?
If your p-value is less than or equal to 0.05 (the significance level), you would conclude that your result is statistically significant. This means the evidence is strong enough to reject the null hypothesis in favor of the alternative hypothesis.
Are all p-values below 0.05 considered statistically significant?No, not all p-values below 0.05 are considered statistically significant. The threshold of 0.05 is commonly used, but it’s just a convention. Statistical significance depends on factors like the study design, sample size, and the magnitude of the observed effect.A p-value below 0.05 means there is evidence against the null hypothesis, suggesting a real effect. However, it’s essential to consider the context and other factors when interpreting results.Researchers also look at effect size and confidence intervals to determine the practical significance and reliability of findings.
Are all p-values below 0.05 considered statistically significant?
No, not all p-values below 0.05 are considered statistically significant. The threshold of 0.05 is commonly used, but it’s just a convention. Statistical significance depends on factors like the study design, sample size, and the magnitude of the observed effect.A p-value below 0.05 means there is evidence against the null hypothesis, suggesting a real effect. However, it’s essential to consider the context and other factors when interpreting results.Researchers also look at effect size and confidence intervals to determine the practical significance and reliability of findings.
No, not all p-values below 0.05 are considered statistically significant. The threshold of 0.05 is commonly used, but it’s just a convention. Statistical significance depends on factors like the study design, sample size, and the magnitude of the observed effect.
A p-value below 0.05 means there is evidence against the null hypothesis, suggesting a real effect. However, it’s essential to consider the context and other factors when interpreting results.
Researchers also look at effect size and confidence intervals to determine the practical significance and reliability of findings.
How does sample size affect the interpretation of p-values?Sample size can impact the interpretation of p-values. A larger sample size provides more reliable and precise estimates of the population, leading to narrower confidence intervals.With a larger sample, even small differences between groups or effects can become statistically significant, yielding lower p-values. In contrast, smaller sample sizes may not have enough statistical power to detect smaller effects, resulting in higher p-values.Therefore, a larger sample size increases the chances of finding statistically significant results when there is a genuine effect, making the findings more trustworthy and robust.
How does sample size affect the interpretation of p-values?
Sample size can impact the interpretation of p-values. A larger sample size provides more reliable and precise estimates of the population, leading to narrower confidence intervals.With a larger sample, even small differences between groups or effects can become statistically significant, yielding lower p-values. In contrast, smaller sample sizes may not have enough statistical power to detect smaller effects, resulting in higher p-values.Therefore, a larger sample size increases the chances of finding statistically significant results when there is a genuine effect, making the findings more trustworthy and robust.
Sample size can impact the interpretation of p-values. A larger sample size provides more reliable and precise estimates of the population, leading to narrower confidence intervals.
With a larger sample, even small differences between groups or effects can become statistically significant, yielding lower p-values. In contrast, smaller sample sizes may not have enough statistical power to detect smaller effects, resulting in higher p-values.
Therefore, a larger sample size increases the chances of finding statistically significant results when there is a genuine effect, making the findings more trustworthy and robust.
Can a non-significant p-value indicate that there is no effect or difference in the data?No, a non-significant p-value does not necessarily indicate that there is no effect or difference in the data. It means that the observed data do not provide strong enough evidence to reject the null hypothesis.There could still be a real effect or difference, but it might be smaller or more variable than the study was able to detect.Other factors like sample size, study design, and measurement precision can influence the p-value. It’s important to consider the entire body of evidence and not rely solely on p-values when interpreting research findings.
Can a non-significant p-value indicate that there is no effect or difference in the data?
No, a non-significant p-value does not necessarily indicate that there is no effect or difference in the data. It means that the observed data do not provide strong enough evidence to reject the null hypothesis.There could still be a real effect or difference, but it might be smaller or more variable than the study was able to detect.Other factors like sample size, study design, and measurement precision can influence the p-value. It’s important to consider the entire body of evidence and not rely solely on p-values when interpreting research findings.
No, a non-significant p-value does not necessarily indicate that there is no effect or difference in the data. It means that the observed data do not provide strong enough evidence to reject the null hypothesis.
There could still be a real effect or difference, but it might be smaller or more variable than the study was able to detect.
Other factors like sample size, study design, and measurement precision can influence the p-value. It’s important to consider the entire body of evidence and not rely solely on p-values when interpreting research findings.
Can P values be exactly zero?While a p-value can be extremely small, it cannot technically be absolute zero. When a p-value is reported asp= 0.000, the actual p-value is too small for the software to display. This is often interpreted as strong evidence against the null hypothesis. For p values less than 0.001, report asp< .001
Can P values be exactly zero?
While a p-value can be extremely small, it cannot technically be absolute zero. When a p-value is reported asp= 0.000, the actual p-value is too small for the software to display. This is often interpreted as strong evidence against the null hypothesis. For p values less than 0.001, report asp< .001
Further Information
Sources:
Goodman, S. N., & Royall, R. (1988). Evidence and scientific research.American Journal of Public Health,78(12), 1568-1574.
Goodman, S. (2008, July).A dirty dozen: twelve p-value misconceptions. InSeminars in hematology(Vol. 45, No. 3, pp. 135-140). WB Saunders.
Lang, J. M., Rothman, K. J., & Cann, C. I. (1998). That confounded P-value.Epidemiology (Cambridge, Mass.),9(1), 7-8.
![]()
Olivia Guy-Evans, MSc
BSc (Hons) Psychology, MSc Psychology of Education
Olivia Guy-Evans is a writer and associate editor for Simply Psychology. She has previously worked in healthcare and educational sectors.
Saul McLeod, PhD
BSc (Hons) Psychology, MRes, PhD, University of Manchester
Saul McLeod, PhD., is a qualified psychology teacher with over 18 years of experience in further and higher education. He has been published in peer-reviewed journals, including the Journal of Clinical Psychology.
