On This Page:ToggleWhat is a Meta-Analysis?What is Effect Size?Real-Life ExamplePractical StepsCommon Mistakes
On This Page:Toggle
On This Page:
What is a Meta-Analysis?
Meta-analysis is a statistical procedure used to combine and synthesize findings from multiple independent studies to estimate the average effect size for a particular research question.
This method addresses limitations like small sample sizes in individual studies, providing a more precise estimate of a treatment effect or relationship strength.
Meta-analyses are particularly valuable when individual study results are inconclusive or contradictory, as seen in the example of vitamin D supplementation and the prevention of fractures.
The results of this meta-analysis suggested that vitamin D supplementation was not associated with a lower risk of fractures among community-dwelling adults. This finding contradicted some earlier beliefs and individual study results that had suggested a protective effect.
What’s the difference between a meta-analysis, systematic review, and literature review?
Literature reviews can be conducted without defined procedures for gathering information.Systematic reviewsuse strict protocols to minimize bias when gathering and evaluating studies, making them more transparent and reproducible.
What is Effect Size?
While a statistically significant result may indicate an effect different from zero, this effect might be too small to hold practical value.Effect size,on the other hand, offers a standardized measure of the magnitude of the effect, allowing for a more meaningful interpretation of the findings
Meta-analysis goes beyond simply synthesizing effect sizes; it uses these statistics to provide a weighted average effect size from studies addressing similar research questions. The larger the effect size the stronger the relationship between two variables.
If effect sizes are consistent, the analysis demonstrates that the findings are robust across the included studies. When there is variation in effect sizes, researchers should focus on understanding the reasons for this dispersion rather than just reporting a summary effect.
There are three primary families of effect sizes used in most meta-analyses:
Real-Life Example
Brewin, C. R., Andrews, B., & Valentine, J. D. (2000). Meta-analysis of risk factors for posttraumatic stress disorder in trauma-exposed adults.Journal of Consulting and Clinical Psychology,68(5), 748.
This meta-analysis of 77 articles examined risk factors for posttraumatic stress disorder (PTSD) in trauma-exposed adults, with sample sizes ranging from 1,149 to over 11,000. Several factors consistently predicted PTSD with small effect sizes (r = 0.10 to 0.19), including female gender, lower education, lower intelligence, previous trauma, childhood adversity, and psychiatric history. Factors occurring during or after trauma showed somewhat stronger effects (r = 0.23 to 0.40), including trauma severity, lack of social support, and additional life stress. Most risk factors did not predict PTSD uniformly across populations and study types, with only psychiatric history, childhood abuse, and family psychiatric history showing homogeneous effects. Notable differences emerged between military and civilian samples, and methodological factors influenced some risk factor effects. The authors concluded that identifying a universal set of pretrauma predictors is premature and called for more research to understand how vulnerability to PTSD varies across populations and contexts.
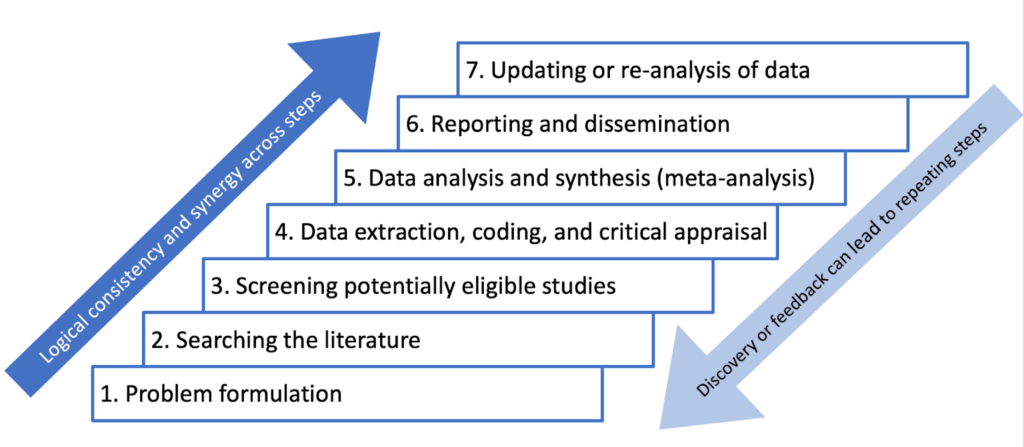
How to Conduct a Meta-Analysis
Researchers should develop a comprehensive research protocol that outlines the objectives and hypotheses of their meta-analysis.
This document should provide specific details about every stage of the research process, including the methodology for identifying, selecting, and analyzing relevant studies.
For example, the protocol should specify search strategies for relevant studies, including whether the search will encompass unpublished works.
The protocol should be created before beginning the research process to ensure transparency and reproducibility.
Research ProtocolObjectivesTo estimate the overall effect of growth mindset interventions on the academic achievement of students in primary and secondary school.To investigate if the effect of growth mindset interventions on academic achievement differs for students of different ages (e.g., elementary school students vs. high school students).To examine if the duration of the growth mindset intervention impacts its effectiveness.HypothesesGrowth mindset interventions will have a small, but statistically significant, positive effect on student academic achievement.Growth mindset interventions will be more effective for younger students than for older students.Longer growth mindset interventions will be more effective than shorter interventions.Eligibility CriteriaPublished studies in English-language journals.Studies must include a quantitative measure of academic achievement (e.g., GPA, course grades, exam scores, or standardized test scores).Studies must involve a growth mindset intervention as the primary focus (including control vs treatment group comparison).Studies that combine growth mindset training with other interventions (e.g., study skills training, other types of psychological interventions) should be excluded.Search StrategyThe researchers will search the following databases:ERICPsycInfoPubMedKeywords Combined with Boolean Operators:(“growth mindset” OR “implicit theories of intelligence” OR “mindset theory”) AND (“intervention” OR “training” OR “program”)” OR “educational outcomes”)OR “pupil” OR “learner”)**Additional Search Strategies:Citation Chaining:Examining the reference lists of included studies can uncover additional relevant articles.Contacting Experts:Reaching out to researchers in the field of growth mindset can reveal unpublished studies or ongoing research.Coding of StudiesThe researchers will code each study for the following information:Sample sizeAge of participantsDuration of interventionType of academic outcome measuredStudy design (e.g., randomized controlled trial, quasi-experiment)Statistical AnalysisThe researchers will calculate an effect size (e.g., standardized mean difference) for each study.The researchers will use a random-effects model to account for variation in effect sizes across studies.The researchers will use meta-regression to test the hypotheses about moderators of the effect of growth mindset interventions.
Research Protocol
Objectives
Hypotheses
Eligibility Criteria
Search Strategy
The researchers will search the following databases:
Coding of Studies
The researchers will code each study for the following information:
Statistical Analysis
 meta analysis
PRISMA
PRISMA (Preferred Reporting Items for Systematic Reviews and Meta-Analyses) is a reporting guideline designed to improve the transparency and completeness of systematic review reporting.
PRISMA was created to tackle the issue of inadequate reporting often found in systematic reviews
Step 1: Defining a Research Question
A well-defined research question is a fundamental starting point for any research synthesis. The research question should guide decisions about which studies to include in the meta-analysis, and which statistical model is most appropriate.
For example:
Step 2: Search Strategy
Present the full search strategies for all databases, registers and websites, including any filters and limits used.
A search strategy is a comprehensive and reproducible plan for identifying all relevant research studies that address a specific research question.
This systematic approach to searching helps minimize bias.
It’s important to be transparent about the search strategy and document all decisions for auditability. The goal is to identify all potentially relevant studies for consideration.
PRISMA(Preferred Reporting Items for Systematic reviews and Meta-Analyses) provide appropriate guidance for reporting quantitative literature searches.
Information Sources
The primary goal is to find all published and unpublished studies that meet the predefined criteria of the research question. This includes considering various sources beyond typical databases
Information sources for a meta-analysis can include a wide range of resources like scholarly databases, unpublished literature, conference papers, books, and even expert consultations.
Specify all databases, registers, websites, organisations, reference lists and other sources searched or consulted to identify studies. Specify the date when each source was last searched or consulted.
An exhaustive, systematic search strategy is developed with the assistance of an expert librarian.
It is important to note that this may not be an exhaustive list of all potential databases.
Search String Construction
It is recommended to consult topic experts on the review team and advisory board in order to create as complete a list of search terms as possible for each concept.
To retrieve the most relevant results, a search string is used. This string is made up of:
When conducting these searches, it is important to combine browsing of texts (publications) with periods of more focused systematic searching. This iterative process allows the search to evolve as the review progresses.
It is important to note that this information may not be entirely comprehensive and up-to-date.
Example:
Specify the inclusion and exclusion criteria for the review.
Before beginning the literature search, researchers should establish clear eligibility criteria for study inclusion
To maintain transparency and minimize bias, eligibility criteria for study inclusion should be established a priori. Ideally, researchers should aim to include only high-qualityrandomized controlled trialsthat adhere to the intention-to-treat principle.
The selection of studies should not be arbitrary, and the rationale behind inclusion and exclusion criteria should be clearly articulated in the research protocol.
Studies were selected if (a) they included a mindfulness-based intervention, (b) they included a clinical sample (i.e., participants had a diagnosable psychological or physical/medical disorder), (c) they included adult samples (18 – 65 years of age), (d) the mindfulness program was not coupled with treatment using acceptance and commitment therapy or dialectical behavior therapy, (e) they included a measure of anxiety and/or mood symptoms at both pre and postintervention, and (f) they provided sufficient data to perform effect size analyses (i.e., means and standard deviations, t or F values, change scores, frequencies, or probability levels). Studies were excluded if the sample overlapped either partially or completely with the sample of another study meeting inclusion criteria for the meta-analysis. In these cases, we selected forinclusion the study with the larger sample size or more complete data for measures of anxiety and depression symptoms. For studies that provided insufficient data but were otherwise appropriate forthe analyses, authors were contacted for supplementary data.
Iterative Process
The iterative nature of developing a search strategy stems from the need to refine and adapt the search process based on the information encountered at each stage.
A single attempt rarely yields the perfect final strategy. Instead, it is an evolving process involving a series of test searches, analysis of results, and discussions among the review team.
Here’s how the iterative process unfolds:
By constantly refining the search strategy based on the results and feedback, researchers can be more confident that they have identified all relevant studies.
This iterative process ensures that the applied search strategy is sensitive enough to capture all relevant studies while maintaining a manageable scope.
Throughout this process, meticulous documentation of the search strategy, including any modifications, is crucial for transparency and future replication of the meta-analysis.
Step 3: Search the Literature
Conduct a systematic search of the literature using clearly defined search terms and databases.
Applying the search strategy involves entering the constructed search strings into the respective databases’ search interfaces. These search strings, crafted using Boolean operators, truncation symbols, wildcards, and database-specific syntax, aim to retrieve all potentially relevant studies addressing the research question.
The researcher, during this stage, interacts with the database’s features to refine the search and manage the retrieved results.
Applying the search strategy is not merely a mechanical process of inputting terms; it demands a thorough understanding of database functionalities and a discerning eye to adjust the search based on the nature of retrieved results.
Step 4: Screening & Selecting Research Articles
Once the literature search is complete, the next step is to screen and select the studies that will be included in the meta-analysis.
This involves carefully reviewing each study to determine its relevance to the research question and its methodological quality.
The goal is to identify studies that are both relevant to the research question and of sufficient quality to contribute to a meaningful synthesis.
Studies meeting the eligibility criteria are usually saved into electronic databases, such asEndnoteorMendeley, and include title, authors, date and publication journal along with an abstract (if available).
Selection Process
Specify the methods used to decide whether a study met the inclusion criteria of the review, including how many reviewers screened each record and each report retrieved, whether they worked independently, and if applicable, details of automation tools used in the process.
The selection process in a meta-analysis involves multiple reviewers to ensure rigor and reliability.
Two reviewers should independently screen titles and abstracts, removing duplicates and irrelevant studies based on predefined inclusion and exclusion criteria.
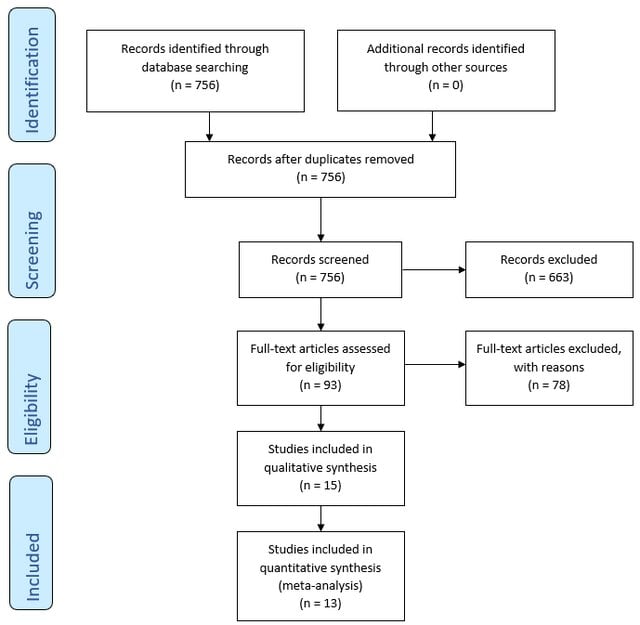
PRISMA Flowchart
ThePRISMA flowchart isa visual representation of the study selection process within a systematic review.
This systematic and transparent approach, as visualized in the PRISMA flowchart, ensures a robust and unbiased selection process, enhancing the reliability of the systematic review’s findings.
The flowchart serves as a visual record of the decisions made during the study selection process, allowing readers to assess the rigor and comprehensiveness of the review.
Source: Białek, M., Gao, Y., Yao, D., & Feldman, G. (2023). Owning leads to valuing: Meta‐analysis of the mere ownership effect.European Journal of Social Psychology,53(1), 90-107.
Step 5: Evaluating the Quality of Studies
Data collection process
Specify the methods used to collect data from reports, including how many reviewers collected data from each report, whether they worked independently, any processes for obtaining or confirming data from study investigators, and if applicable, details of automation tools used in the process.
Data extraction focuses on information relevant to the research question, such as risk or recovery factors related to a particular phenomenon.
Extract data relevant to the research question, such as effect sizes, sample sizes, means, standard deviations, and other statistical measures.
It can be useful to focus on the authors’ interpretations of findings rather than individual participant quotes, as the latter lacks the full context of the original data.
The coding of studies in a meta-analysis involves carefully and systematically extracting data from each included study in a standardized and reliable manner. This step is essential for ensuring the accuracy and validity of the meta-analysis’s findings.
This information is then used to calculate effect sizes, examine potential moderators, and draw overall conclusions.
Coding procedures typically involve creating a standardized record form or coding protocol. This form guides the extraction of data from each study in a consistent and organized manner. Two independent observers can help to ensure accuracy and minimize errors during data extraction.
Beyond basic information like authors and publication year, code crucial study characteristics relevant to the research question.
For example, if the meta-analysis focuses on the effects of a specific therapy, relevant characteristics to code might include:
Before applying the coding protocol to all studies, it’s crucial to pilot test it on a small subset of studies. This helps identify any ambiguities, inconsistencies, or areas for improvement in the coding protocol before full-scale coding begins.
It’s common to encounter missing data in primary research articles. Develop a clear strategy for handling missing data, which might involve contacting study authors, using imputation methods, or performing sensitivity analyses to assess the impact of missing data on the overall results.
Quality Appraisal Tools
Researchers use standardized tools to assess the quality and risk of bias in the quantitative studies included in the meta-analysis. Some commonly used tools include:
By using these tools, researchers can ensure that the studies included in their meta-analysis are of high methodological quality and contribute reliable quantitative data to the overall analysis.
Step 6: Choice of Effect Size
Conversion of efect sizes to a common measure
May be necessary to convert reported findings to the chosen primary effect size. The goal is to harmonize different effect size measures to a common metric for meaningful comparison and analysis.
This conversion allows researchers to include studies that report findings using various effect size metrics. For instance, r can be approximately converted to d, and vice versa, using specific equations. Similarly, r can be derived from an odds ratio using another formula.
Many equations relevant to converting effect sizes can be found in Rosenthal (1991).
Step 7: Assessing Heterogeneity
Heterogeneity refers to the variation in effect sizes across studies after accounting for within-study sampling errors.
Heterogeneity refers to how much the results (effect sizes) vary between different studies, where no variation would mean all studies showed the same improvement (no heterogeneity), while greater variation indicates more heterogeneity.
Assessing heterogeneity matters because it helps us understand if the study intervention works consistently across different contexts and guides how we combine and interpret the results of multiple studies.
While little heterogeneity allows us to be more confident in our overall conclusion, significant heterogeneity necessitates further investigation into its underlying causes.
How to assess heterogeneity
Step 8: Choosing the Meta-Analytic Model
Use a random-effects model if heterogeneity is high. Use a fixed-effect model if heterogeneity is low, or if all studies are functionally identical and you are not seeking to generalize to a range of scenarios.
Although a statistical test for homogeneity can help assess the variability in effect sizes across studies, it shouldn’t dictate the choice between fixed and random effects models.
If the number of studies is limited, a fixed-effects analysis is more appropriate, while more studies are required for a stable estimate of the between-study variance in a random-effects model.
It is important to note that using a random-effects model is generally a more conservative approach.
Fixed-effects models
This means that larger studies, which generally have smaller variances, are assigned greater weight in the analysis because they provide more precise estimates of the common effect size
Random-effects models
Random-effects models assume that the true effect size can vary across studies. The goal here is to estimate the mean of these varying effect sizes, considering both within-study variance and between-study variance (heterogeneity).
This approach acknowledges that each study might estimate a slightly different effect size due to factors beyond sampling error, such as variations in study populations, interventions, or designs.
This balanced weighting prevents large studies from disproportionately influencing the overall effect size estimate, leading to a more representative average effect size that reflects the distribution of effects across a range of studies.
Step 9: Perform the Meta-Analysis
This step involves statistically combining effect sizes from chosen studies. Meta-analysis uses the weighted mean of effect sizes, typically giving larger weights to more precise studies (often those with larger sample sizes).
It uses a weighted mean of the effect sizes, typically giving larger weights to more precise studies, often those with larger sample sizes.
This weighting scheme makes statistical sense because an effect size with good sampling accuracy (i.e., likely to be an accurate reflection of reality) is weighted highly.
On the other hand, effect sizes from studies with lower sampling accuracy are given less weight in the calculations.
Estimating effect size using fixed effects
The fixed-effects model in meta-analysis operates under the assumption that all included studies are estimating the same true effect size.
This model focuses solely on within-study variance when determining the weight of each study.
The weight is calculated as the inverse of the within-study variance, which typically results in larger studies receiving substantially more weight in the analysis.
This approach is based on the idea that larger studies provide more precise estimates of the true effect.
1. Calculate weights (wi) for each study:
The weight is often the inverse of the variance of the effect size. This means studies with larger sample sizes and less variability will have greater weight, as they provide more precise estimates of the effect size
This weighting scheme reflects the assumption in a fixed-effect model that all studies are estimating the same true effect size, and any observed differences in effect sizes are solely due to sampling error. Therefore, studies with less sampling error (i.e., smaller variances) are considered more reliable and are given more weight in the analysis.
Here’s the formula for calculating the weight in a fixed-effect meta-analysis:
3. Add up all these weighted effects:
Implications of the fixed-effects model
Estimating effect size using random effects
Random effects meta-analysis is slightly more complicated because multiple sources of differences potentially affecting effect sizes must be accounted for.
The main difference in the random effects model is the inclusion of τ² (tau squared) in the weight calculation. This accounts for between-study heterogeneity, recognizing that studies might be measuring slightly different effects.
This process results in an overall effect size that takes into account both within-study and between-study variability, making it more appropriate when studies differ in methods or populations.
The model estimates the variance of the true effect sizes (τ²). This requires a reasonable number of studies, so random effects estimation might not be feasible with very few studies.
Estimation is typically done using statistical software, with restricted maximum likelihood (REML) being a common method.
1. Calculate weights for each study:
In a random-effects meta-analysis, the weight assigned to each study (W*i) is calculated as the inverse of that study’s variance, similar to a fixed-effect model. However, the variance in a random-effects model considers both the within-study variance (VYi) and the between-studies variance (T^2).
The inclusion of T^2 in the denominator of the weight formula reflects the random-effects model’s assumption that the true effect size can vary across studies.
This means that in addition to sampling error, there is another source of variability that needs to be accounted for when weighting the studies. The between-studies variance, T^2, represents this additional source of variability.
Here’s the formula for calculating the weight in a random-effects meta-analysis:
First, we need to calculate something called τ² (tau squared). This represents the between-study variance.
The estimation of T^2 can be done using different methods, one common approach being the method of moments (DerSimonian and Laird method).
The formula for T^2 using the method of moments is:T^2 = (Q – df) / C
Sum up all the products from step 2.
Implications of the random-effects model
Step 10: Sensitivity Analysis
This is especially important since opinions may differ on the best approach to conducting a meta-analysis, making the exploration of these variations crucial.
By systematically varying different aspects of the meta-analysis, researchers can assess the robustness of their findings and address potential concerns about the validity of their conclusions.
This process ensures a more reliable and trustworthy synthesis of the research evidence.
Common Mistakes
When conducting a meta-analysis, several common pitfalls can arise, potentially undermining the validity and reliability of the findings. Sources caution against these mistakes and offer guidance on conducting methodologically sound meta-analyses.
Reading List
![]()
Olivia Guy-Evans, MSc
BSc (Hons) Psychology, MSc Psychology of Education
Olivia Guy-Evans is a writer and associate editor for Simply Psychology. She has previously worked in healthcare and educational sectors.
Saul McLeod, PhD
BSc (Hons) Psychology, MRes, PhD, University of Manchester
Saul McLeod, PhD., is a qualified psychology teacher with over 18 years of experience in further and higher education. He has been published in peer-reviewed journals, including the Journal of Clinical Psychology.
